How Safe is the Rust Ecosystem? A Deep Dive into crates.io
Auditing the Rust Ecosystem: Analyzing crates.io with cargo-deny
The relentless wave of high-impact supply chain attacks throughout 2025—most notably the major incident within npm (in more details you could read at https://www.paloaltonetworks.com/blog/cloud-security/npm-supply-chain-attack/) —suggests this trend is far from peaking. In fact, with the rapid adoption of AI and LLMs in development workflows, we are likely facing an acceleration of these threats rather than a decline, in my opinion.
Thats why it highlighting the urgent need for rigorous security practices across all programming languages. As a Rust dev and part of the Rust community, and (obviously!) active consumer of packages from crates.io, I am more than concerned how Rust ecosystem would stand against such threats.
- How resilient is the Rust ecosystem against these evolving threats?
- Can we be certain that the thousands of packages we rely on are free from known vulnerabilities and adhere to strict quality standards?
The goal of this post is to analyze the overall quality of the Rust ecosystem, by leveraging the powerful tool cargo-deny, to conduct a comprehensive audit of crates.io packages.
Data gathering
A custom CLI tool to gather data from crates.io was developed. The registry snapshot index based on the crates.io-index repo (full snapshot of the latest crates.io packages index).
The following logic is applied to construct the dataset:
- Latest Versions Only: is processed only the most recent, non-yanked version of every crate.
- Fresh Resolution For Libraries: The most recent dependency tree, simulating a fresh install of the library.
- Locked Resolution For Binaries: The pinned dependency tree from registries
Cargo.lockfile (equivalent tocargo install <crate> --locked). - Audit Engine: cargo-deny is used as a library to scan every package for advisory failures.
- Error Filtering: If an error returned at any stage of crate processing (downloading, analyzing, etc.), it is skipped entirely and not included into the final dataset.
All code is open sourced https://raw.githubusercontent.com/Mr-Leshiy/crates.io_analysis
Dataset
The analysis is based on a dataset
generated from a snapshot of the crates.io-index at commit
746a989,
dated January 15, 2026.
It consists of the following columns:
name- The crate’s nameversion- The crate’s version.downloads: The download count for that specific version, not the total downloads amount of the crate from crates.io.created_at- The publication date of the crate.direct_deps- The number of direct dependencies.all_deps- The total number of all dependencies from the crate’s dependency tree- Advisories Diagnostics: The number of failures per specific
advisorycheck:
Analysis
During the analysis the focus is narrowed to the most critical metrics:
a:vulnerability, a:unsound, a:notice, a:unmaintained and a:yanked.
ℹ️ Click here to view detailed definitions of these Advisory Diagnostics
ℹ️ Click here to view detailed definitions of these Advisory Diagnostics
vulnerability- Meaning: A specific security vulnerability (CVE) has been identified in the dependency or in the crate itself.
- Context: This is the most critical check. It indicates the crate version contains code that could be exploited (e.g., via memory corruption or denial of service). Users typically need to upgrade to a fixed version immediately.
unsound- Meaning: The crate contains “unsound” code.
- Context: In Rust, “soundness” refers to code that strictly upholds the language’s memory safety guarantees. If a crate is flagged as unsound, it usually means it uses
unsafeblocks in a way that could lead to undefined behavior (like segmentation faults) under valid usage, violating Rust’s safety contract.
notice- Meaning: An informational advisory.
- Context: These are generally low-severity issues or notifications that do not fit into the other categories, such as warnings about future deprecation or minor issues that do not strictly qualify as vulnerabilities.
unmaintained- Meaning: The crate (or the specific version/branch in use) is no longer actively developed or supported.
- Context: While not an immediate security threat, relying on unmaintained code is a significant risk. If a vulnerability is discovered later, it is unlikely to be patched. This serves as a warning to investigate a replacement or a maintained fork.
yanked- Meaning: The specific version of the crate has been “yanked” (retracted) from the registry by its authors.
- Context: While yanked versions remain available for existing builds (to avoid breaking
Cargo.lock), they cannot be added as new dependencies. Yanks often signal that a version was published by mistake, contains a severe bug, or has been superseded due to a non-critical issue.
Note: The columns
a:notice,a:unmaintained, anda:yankedare not treated as critical failures in this context. Instead, they are viewed as additional insights, similar to the Supplemental metric group in CVSS.
General overview
General overview
Lets start with the general overview of the crates.io distribution based on their popularity (downloads column).
In original download-distribution the distance between min-and max is big, so log-distribution is used instead.
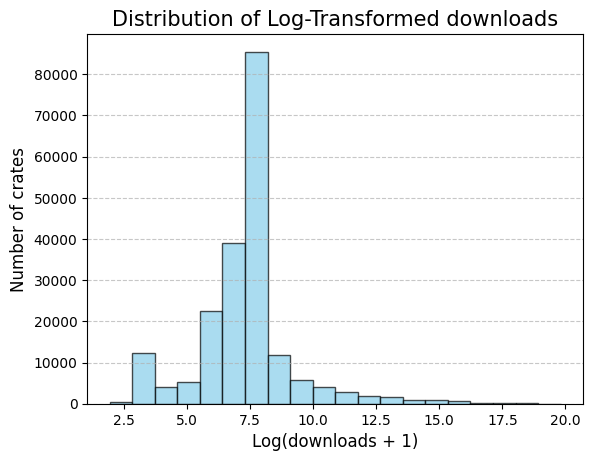
As shown by the log-transformed download distribution, there is a spike at the lower end corresponding to packages with very few downloads.
These packages are often experimental, inactive, or used by a negligible number of users.
Since the goal of this analysis is to study vulnerabilities in packages that have a meaningful impact on the ecosystem,
we restrict our focus to relatively more widely used packages and exclude this extreme low-download tail.
So crates with less than 50 downloads have been cut, which corresponds to 15% or 34 717.
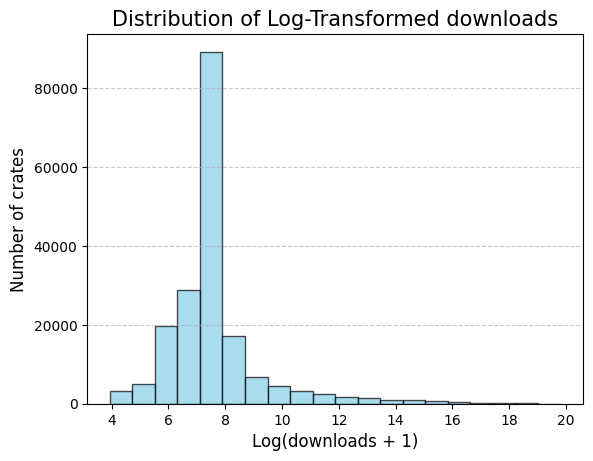
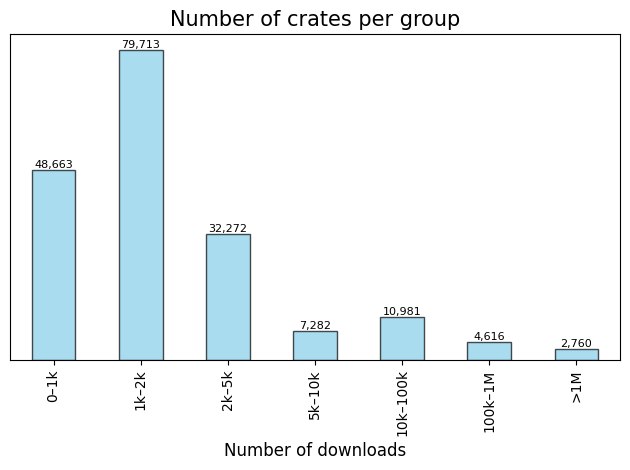
Based on the distribution and for the future reference, crates would be splitted into popularity groups based on the number of downloads.
Advisory vulnerability and unsound
Advisory vulnerability and unsound
The next step would be to analyze safeness and secureness of packages, based only on vulnerability and unsound advisories.
| Category | Percentage | Count |
|---|---|---|
| Total | — | 196 923 |
| 🟢 Passed | 67.515% | 139 229 |
| 🔴 Failed | 32.485% | 66 991 |
Note: The Failed count represents crates for which
vulnerabilityorunsoundfailed at least once.
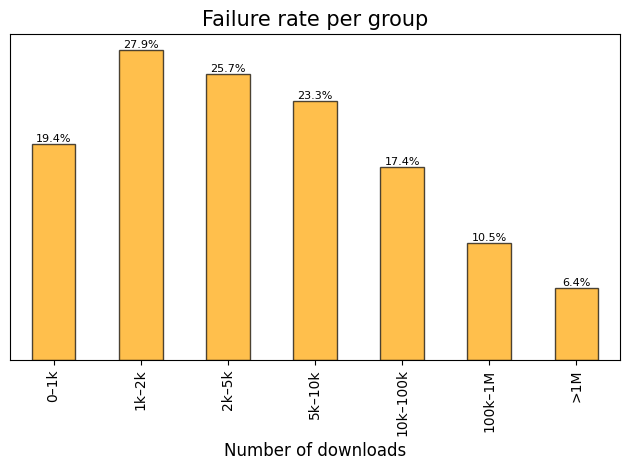
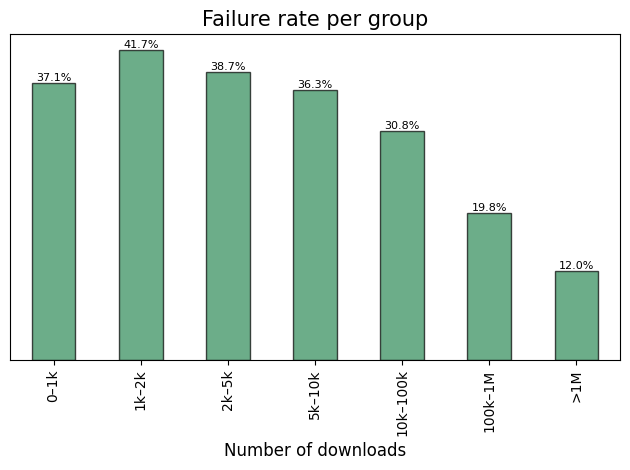
Failure Rate Distribution by Popularity:
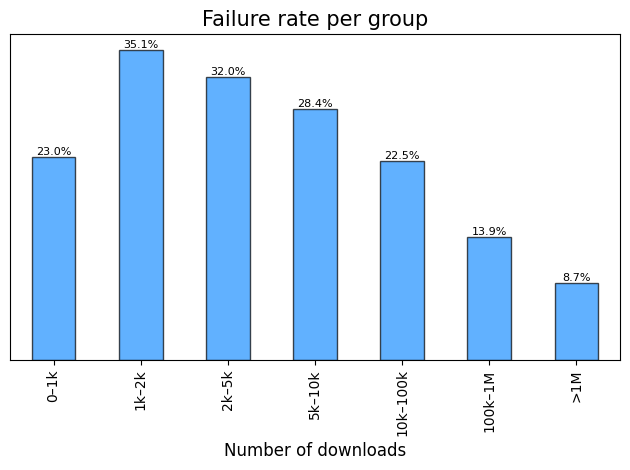
Note: Failure rate represents the percentage of crates within a specific group that failed the check.
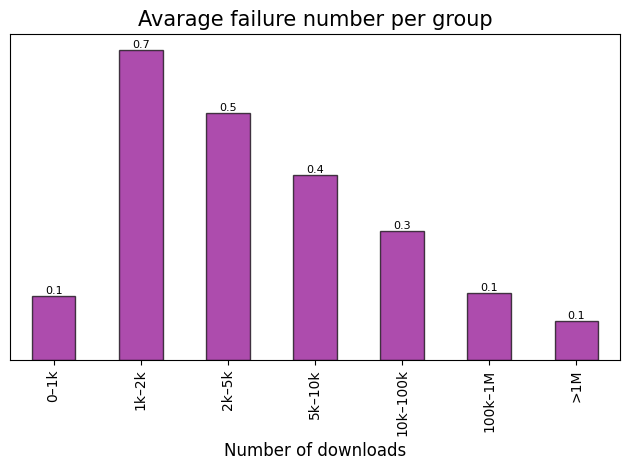
Average Failure Number by Popularity:
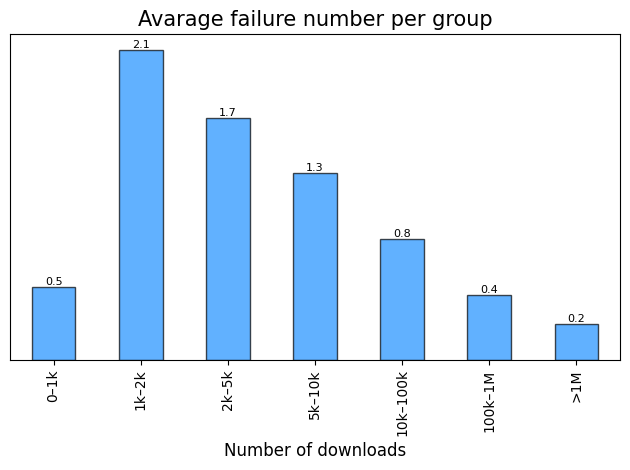
Note: Average failure number represents the mean value of
vulnerabilityandunsoundfailures per a specific group. Across only instances which fails.
Advisory vulnerability
Advisory vulnerability
| Category | Percentage | Count |
|---|---|---|
| Total | — | 196 923 |
| 🟢 Passed | 73.992% | 145 707 |
| 🔴 Failed | 26.008% | 51 216 |
Note: The Failed count represents crates for which
vulnerabilityfailed at least once.
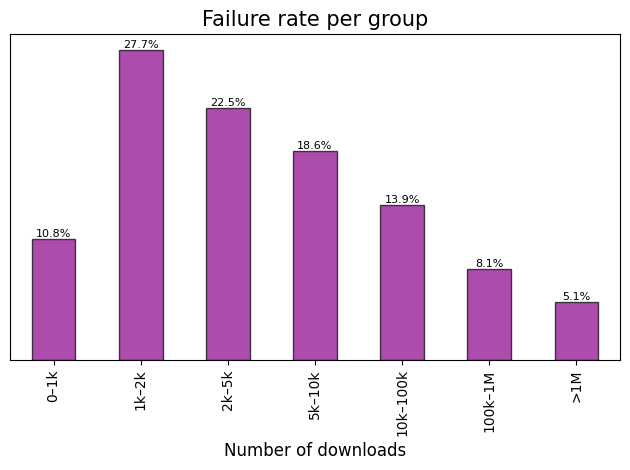
Failure rate distribution across established popularity groups.
Note: Failure rate represents the percentage of crates within a specific group that failed the check.
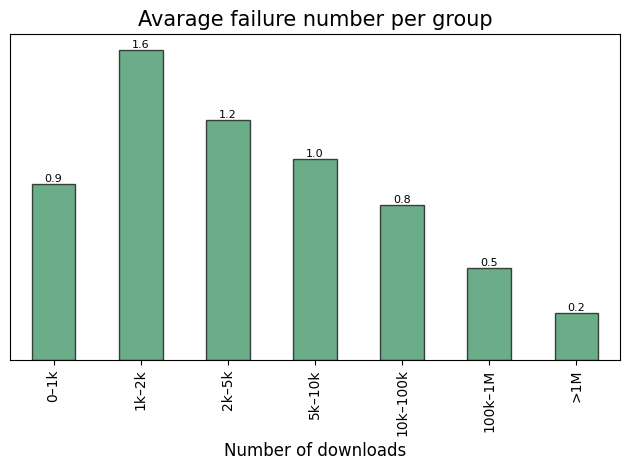
Average failure number across established popularity groups.
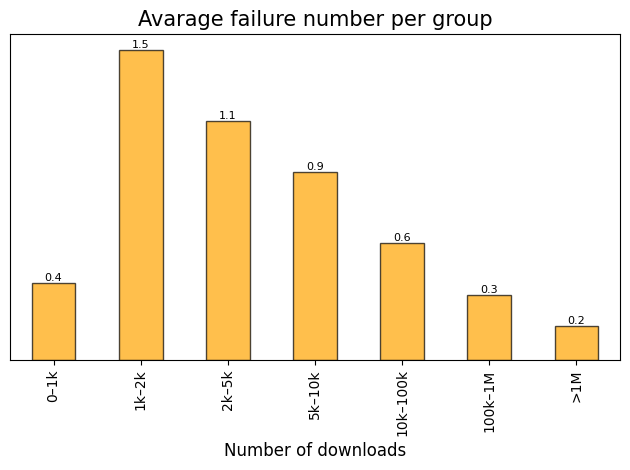
Note: Average failure number represents the mean value of
vulnerabilityfailures per a specific group. Across only instances which fails.
Advisory unsound
Advisory unsound
| Category | Percentage | Count |
|---|---|---|
| Total | — | 196 923 |
| 🟢 Passed | 75.754% | 149 178 |
| 🔴 Failed | 24.246% | 47 745 |
Note: The Failed count represents crates for which
unsoundfailed at least once.
Failure rate distribution across established popularity groups.
Note: Failure rate represents the percentage of crates within a specific group that failed the check.
Average failure number across established popularity groups.
Note: Average failure number represents the mean value of
unsoundfailures per a specific group. Across only instances which fails.
Advisory notice
Advisory notice
| Category | Percentage | Count |
|---|---|---|
| Total | — | 196 923 |
| 🟢 Passed | 99.986% | 196 896 |
| 🔴 Failed | 0.014% | 27 |
Note: The Failed count represents crates for which
noticefailed at least once.
Given the negligible failure rate for this advisory, further detailed investigation is not required.
Advisory unmaintained and yanked
Advisory unmaintained and yanked
| Category | Percentage | Count |
|---|---|---|
| Total | — | 196 923 |
| 🟢 Passed | 59.446% | 117 062 |
| 🔴 Failed | 40.554% | 79 861 |
Note: The Failed count represents crates for which
unmaintainedoryankedfailed at least once.
Failure rate distribution across established popularity groups.
Note: Failure rate represents the percentage of crates within a specific group that failed the check.
Average failure number across established popularity groups.
Note: Average failure number represents the mean value of
unmaintainedandyankedfailures per a specific group. Across only instances which fails.
Does a lack of recent updates increase vulnerability risks?
Does a lack of recent updates increase vulnerability risks?
There is a common belief in software engineering that code “rots”—that if a package hasn’t been touched in years, it eventually becomes a security liability. Is it true based on the collected data?
I wanted to test this hypothesis by looking at Release Recency. Put simply: Is there a correlation between how long a crate has gone without an update and its likelihood of containing vulnerabilities?
Using the date of the latest release (created_at column) as freshness characteristics,
let’s see if stale packages really are more dangerous than active ones, based on vulnerability and unsound advisories.
| Test | Coefficient | P-Value |
|---|---|---|
| Pearson | 0.1831 | 0.0 |
| Spearman | 0.1713 | 0.0 |
| Kendall | 0.1315 | 0.0 |
The P-value of 0.0 across all tests confirms that the relationship is statistically significant—the pattern is not due to random chance.
However, the correlation coefficients indicate a weak positive correlation.
Verdict: while older packages are slightly more likely to have issues, inactivity alone is not a strong predictor of insecurity. It is a contributing factor, but certainly not a definitive smoking gun.
Does more dependencies increase vulnerability risks?
Does more dependencies increase vulnerability risks?
There is a common sentiment in software engineering:
“Every line of code is a liability.”
By extension, every additional dependency you add expands your potential attack surface.
I wanted to test this by looking at the Total Dependency Count. Put simply: Does a higher number of dependencies directly increase the probability of a crate having vulnerability flags?
Using the full dependency tree size (all_deps column) as a measure of complexity,
let’s see if “heavier” crates are actually more dangerous than lightweight ones,
based on vulnerability and unsound advisories.
| Test | Coefficient | P-Value |
|---|---|---|
| Pearson | 0.3888 | 0.0 |
| Spearman | 0.6073 | 0.0 |
| Kendall | 0.4840 | 0.0 |
As in the previous analysis,
the P-value of 0.0 across all tests confirms that the relationship is statistically significant—the pattern is not due to random chance.
However, unlike the previous analysis on freshness, The Spearman coefficient indicates a moderate to strong positive correlation, suggesting that as dependency ranks increase, risk ranks rise consistently.
Verdict: the data strongly supports the liability hypothesis. Increasing the size of the dependency tree directly and significantly increases the risk of inheriting a vulnerability. Complexity is a much stronger predictor of insecurity than age.
Conclusion & Next Steps
If you scrolled past the data to get to the end, don’t worry—I can’t blame you! 😉
The analysis shows a quite concerning situation in the Rust ecosystem. A significant portion, around 20%, of actively used crates fail to pass a standard configuration of the cargo-deny tool.
Beyond the raw numbers, the data uncovers a clear chain of causality regarding project safety:
More dependencies → Higher complexity → Higher vulnerability risk
While the ecosystem is vibrant, this complexity penalty suggests that blindly adding packages is a dangerous strategy.
What to do ?
Security is not a state, it is a process.
Based on these findings, here are three immediate steps you can take to improve your projects:
- Integrate Auditing Tooling: Don’t wait for a breach. Add tools like cargo-deny to your CI/CD pipeline today to catch vulnerabilities before they merge.
- Prune Your Tree: Be wise and cautious when adding new dependencies. Every
crateyou add brings its own tree of transitive dependencies—and potential risks. - Be an Active Collaborator: The ecosystem is only as strong as its contributors. If you encounter a vulnerability or an unmaintained crate,consider submitting a PR or offering to help maintain it rather than just waiting for a fix.
The Rust ecosystem is growing up, so our practices for consuming it must mature as well and thats how everyone could step forward and help improving it 🚀.
Acknowledgments
Many thanks for my beloved wife (https://github.com/Marynochka) for helping with the analysis.